The Doppler effect, explained with an interactive simulation
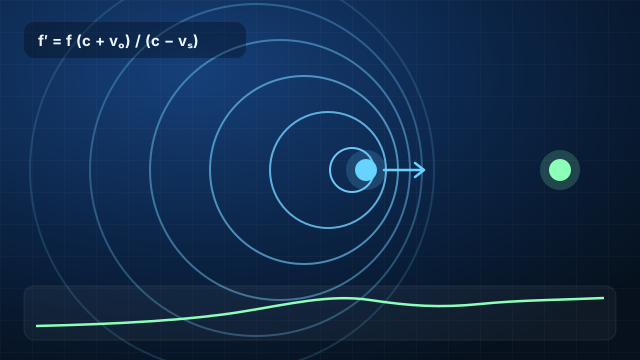
Stand by a road and listen to a car sounding its horn as it passes. The pitch is higher as the car approaches and drops the moment it goes by. The horn itself never changes. What changes is how often the crests of the sound wave reach your ear. This is the Doppler effect, and once you see it, you will notice it everywhere — from sirens to weather radar to the light of distant galaxies.
What is the Doppler effect?
The Doppler effect is the change in the observed frequency of a wave when the source, the observer, or both are moving relative to the medium. A source at rest sends out wavefronts as evenly spaced circles. When the source moves, each new wavefront starts from a slightly different place. In front of the source the fronts crowd together; behind it they spread apart.
Shorter spacing means a shorter wavelength, and because the wave still travels at the speed of sound, crests arrive more often: the observed frequency goes up. Behind the source the opposite happens and the frequency goes down.
The Doppler formula
For sound, with motion along the line joining source and observer:
f′ = f · (c + vₒ) / (c − vₛ)
- f is the frequency emitted by the source,
- f′ is the frequency heard by the observer,
- c is the speed of sound in the medium (about 343 m/s in air at 20 °C),
- vₒ is the observer’s speed toward the source, and vₛ is the source’s speed toward the observer.
Speeds are positive when the two are moving toward each other. If they move apart, use negative values.
A worked example
An ambulance siren emits 700 Hz and drives toward you at 25 m/s. You are standing still, so vₒ = 0:
f′ = 700 × 343 / (343 − 25) ≈ 755 Hz
After it passes and moves away at the same speed, vₛ = −25 m/s and f′ ≈ 652 Hz. That drop of about 100 Hz is the familiar “neee-owww”.
What happens at supersonic speed?
As the source speeds up, the wavefronts in front of it get closer and closer. When the source reaches the speed of sound (Mach 1), they pile up into a single strong front. Faster than that, the source outruns its own waves, and the fronts form a cone behind it: the Mach cone. Its half-angle μ depends only on the Mach number M = vₛ / c:
sin μ = 1 / M
At Mach 2, μ = 30°. When the edge of that cone sweeps over the ground, people hear a sonic boom.
Try it yourself
The ExScim Doppler effect simulation lets you drag the source and observer, change the speed of sound, add wind and jump to scenarios such as “approach”, “away” and “supersonic”. A live graph shows the observed frequency, the formula updates with your numbers, and in supersonic mode the Mach angle is measured on screen.
A good first experiment: set the source speed to half the speed of sound and predict the observed frequency before pressing Start. Then check your answer on the graph.
Where the Doppler effect is used
- Medical ultrasound measures blood flow by the frequency shift of echoes from moving blood cells.
- Weather radar detects the motion of rain inside storms.
- Police radar measures the speed of cars.
- Astronomy uses the redshift of light to measure how fast galaxies move away from us.
Key points
- The source’s frequency doesn’t change; the rate at which crests reach the observer does.
- Approaching means a higher frequency; moving apart means a lower one.
- Above the speed of sound, wavefronts form a Mach cone with sin μ = 1/M.